Concept
Few tools exist to visualize poetry, making rhyme an exciting frontier for data visualization. This project helps users instantly grasp a poet’s most common phoneme endings, detect imperfect rhymes, and explore word connections across an entire corpus.
Users can click on phoneme groups to explore detailed visualizations, where nodes represent rhymed words and links connect rhyming lines. I analyzed two poet datasets—Shakespeare’s sonnets and Alexander Pope’s couplets—chosen for their distinct styles and eras, demonstrating how rhyme structures vary across literary traditions.
Homepage
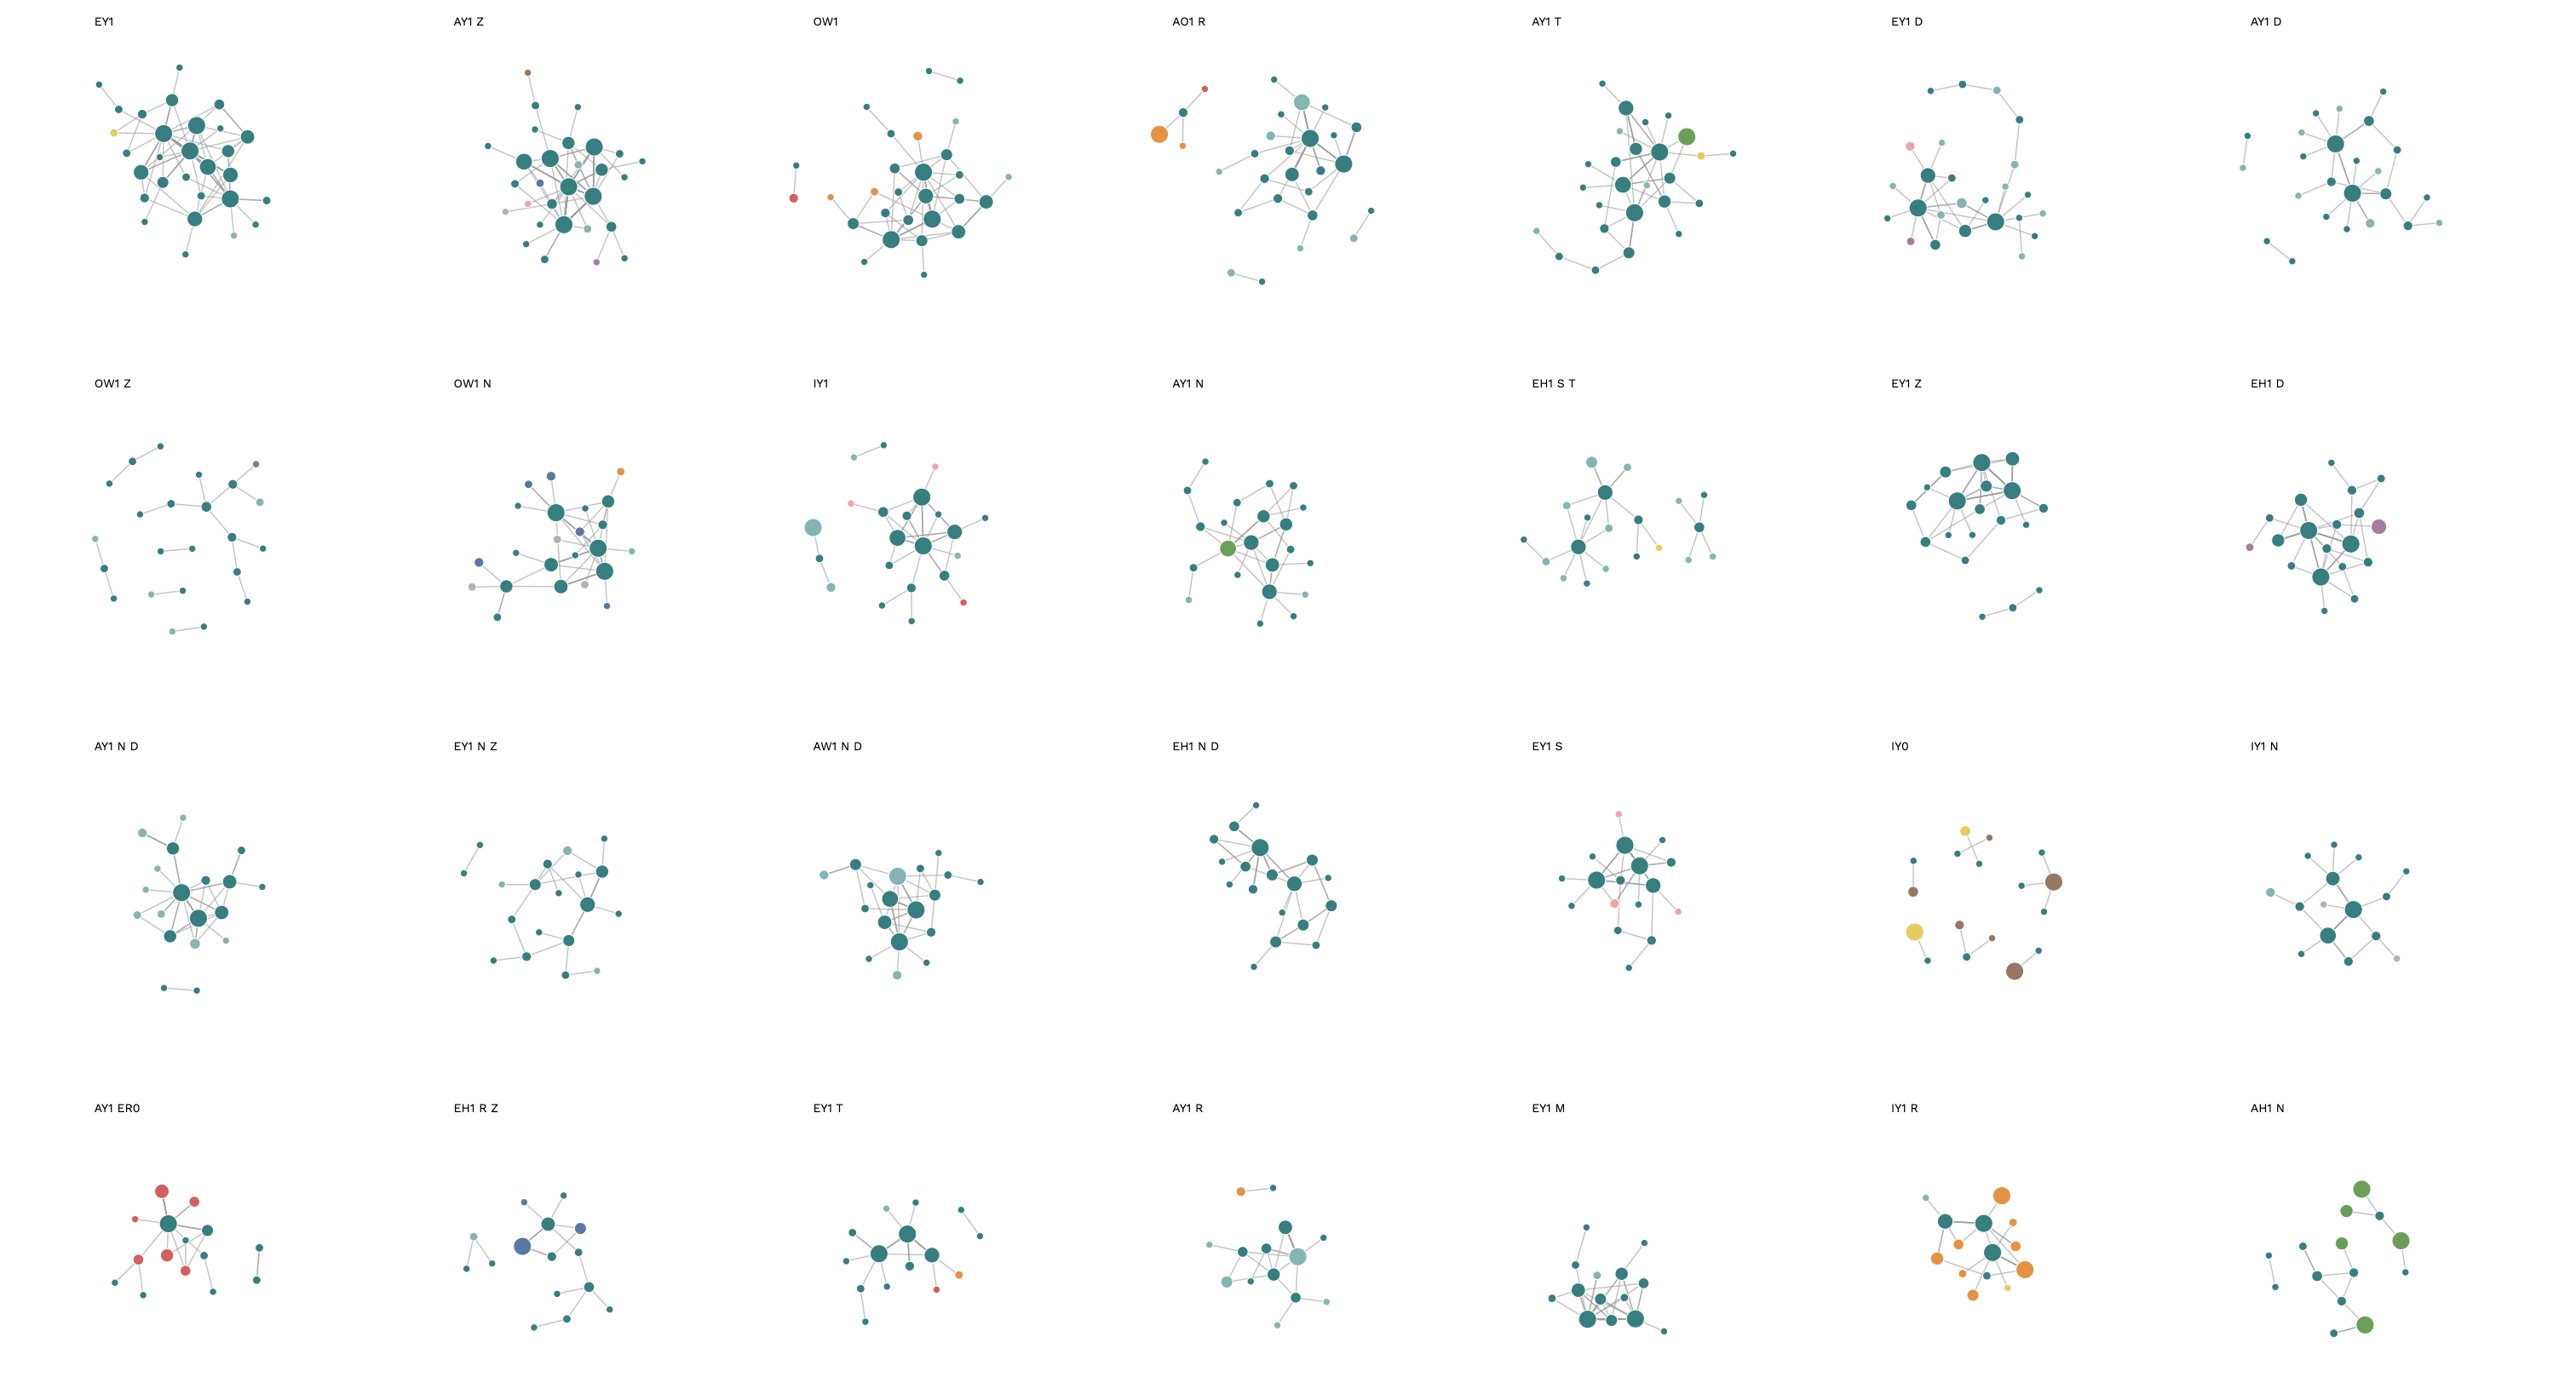
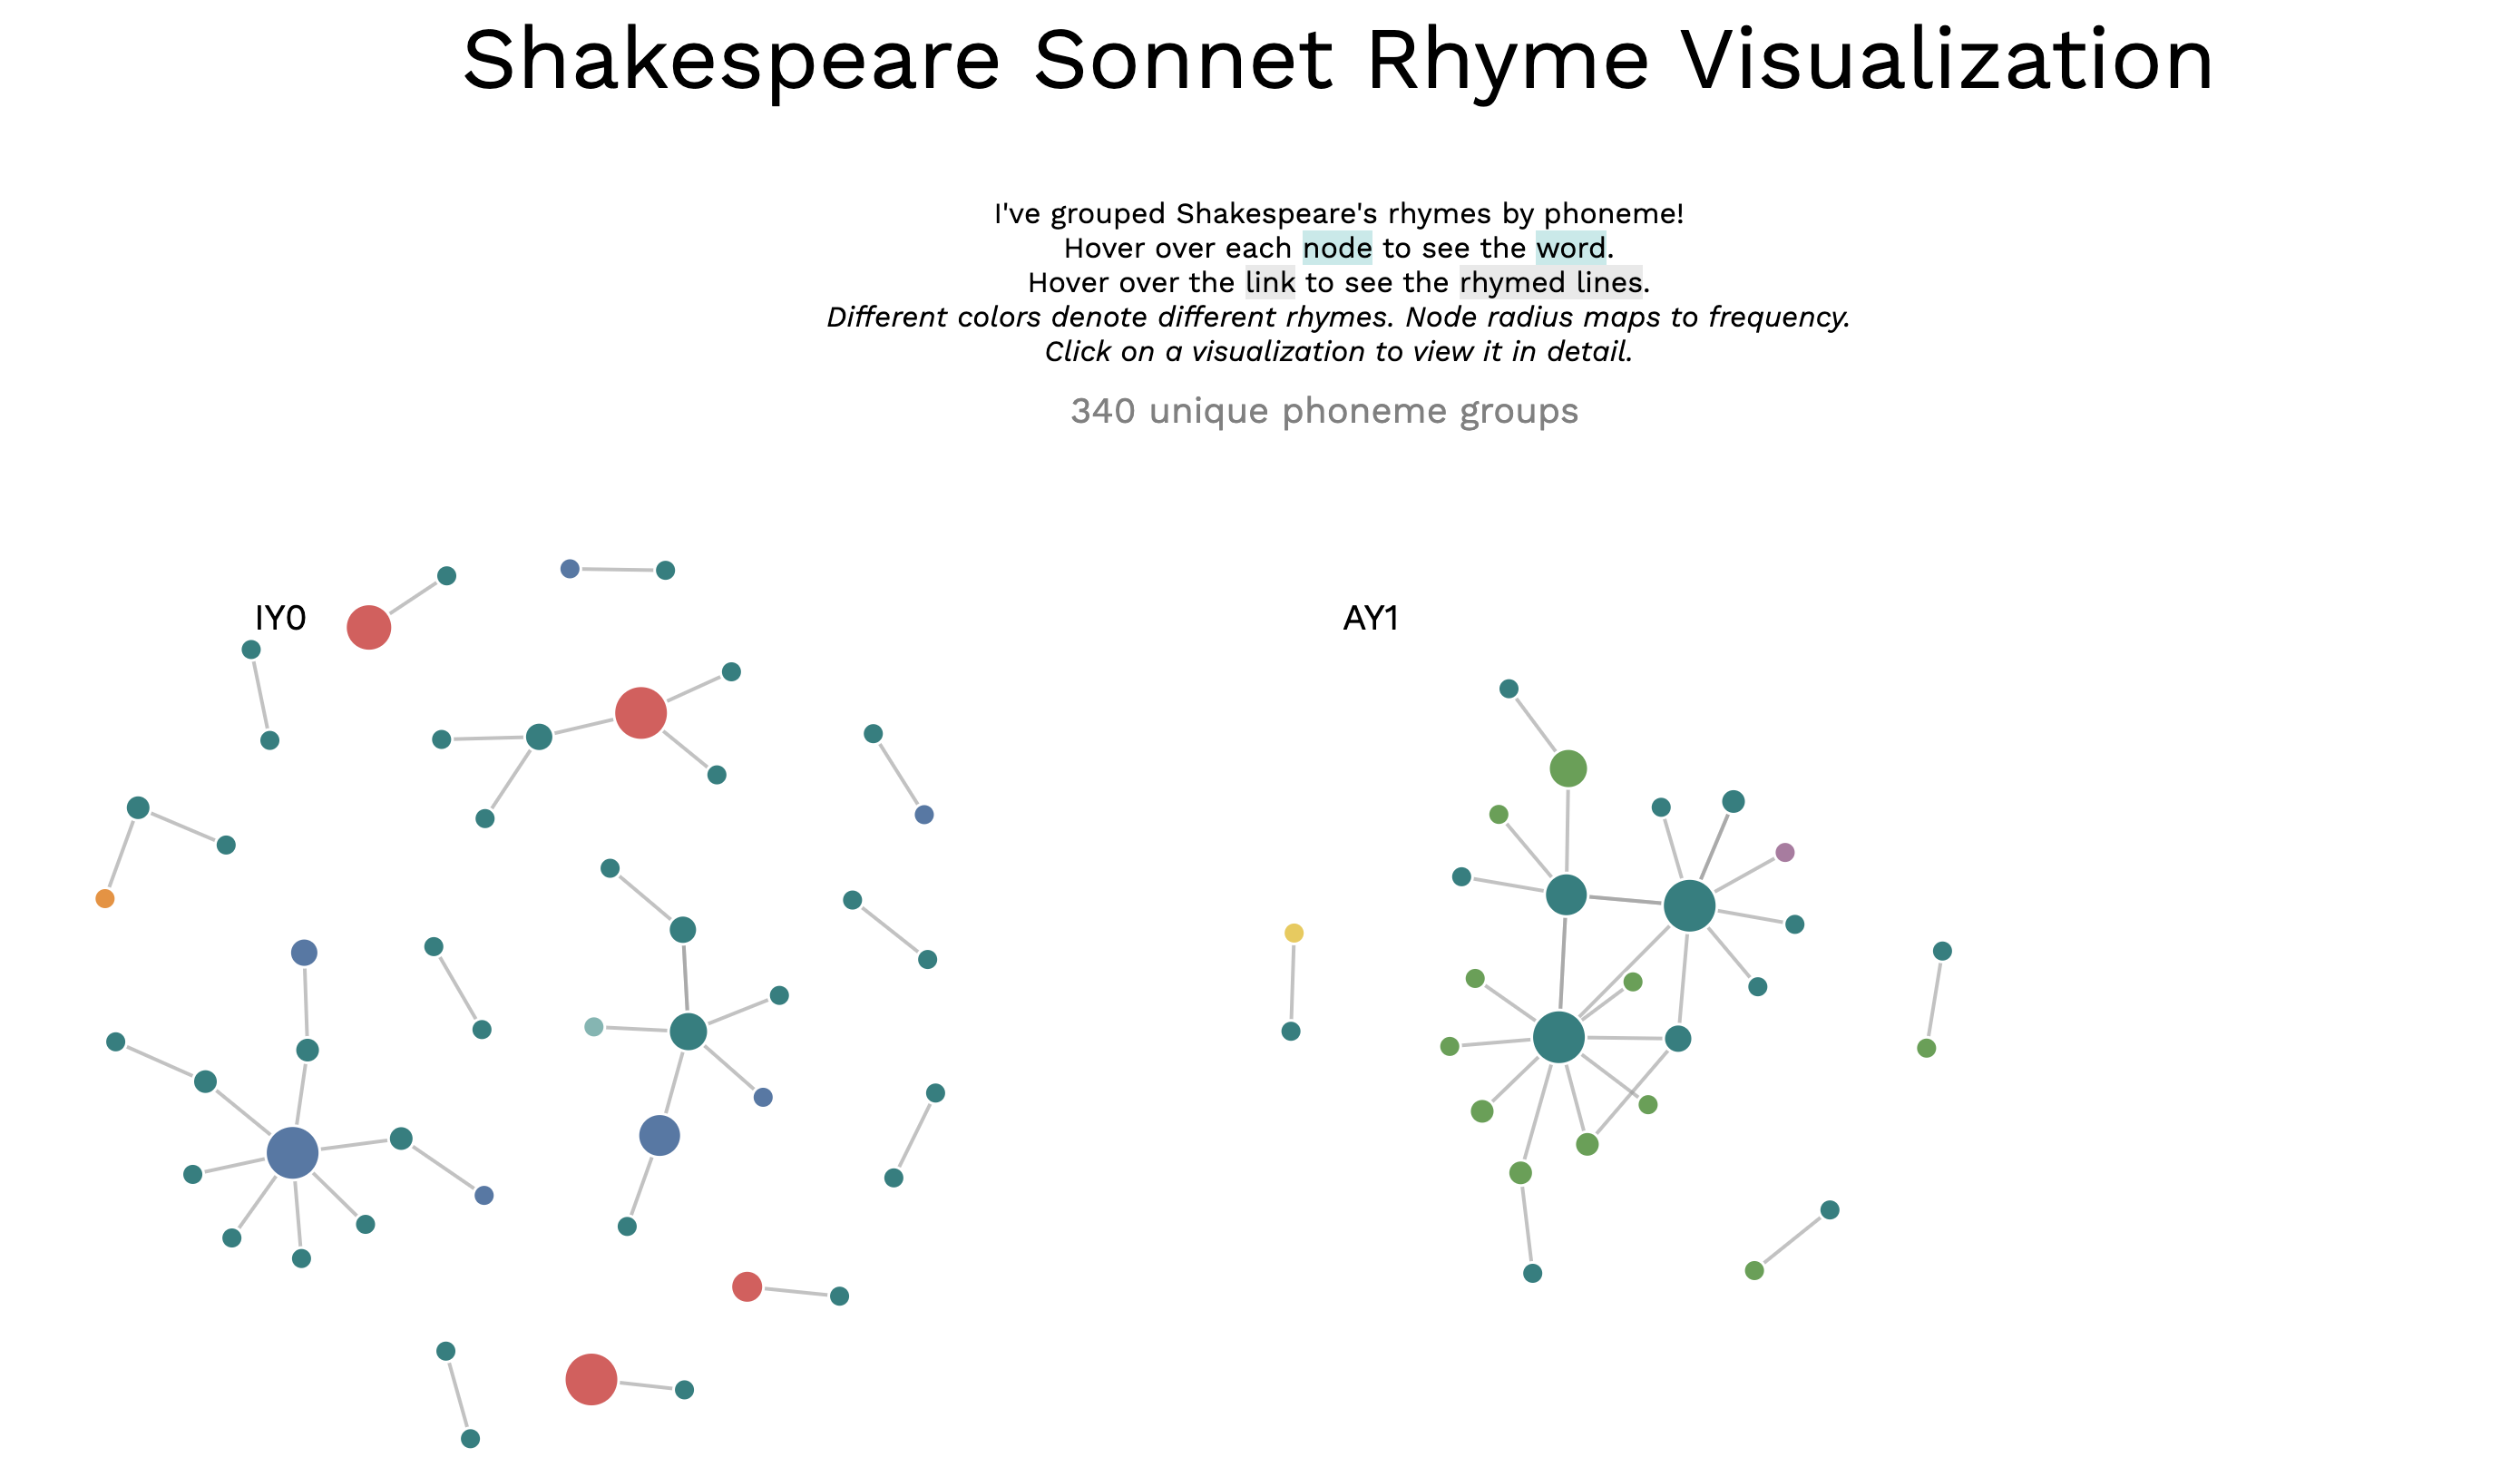
The main page displays all rhymed phoneme groups, sorted by the number of nodes. Users can interact with the diagrams by dragging nodes or hovering to reveal corresponding words.
The network visualization maps the topography of a poet’s rhymes, instantly highlighting patterns and drawing attention to rhymed outliers.
Details Page
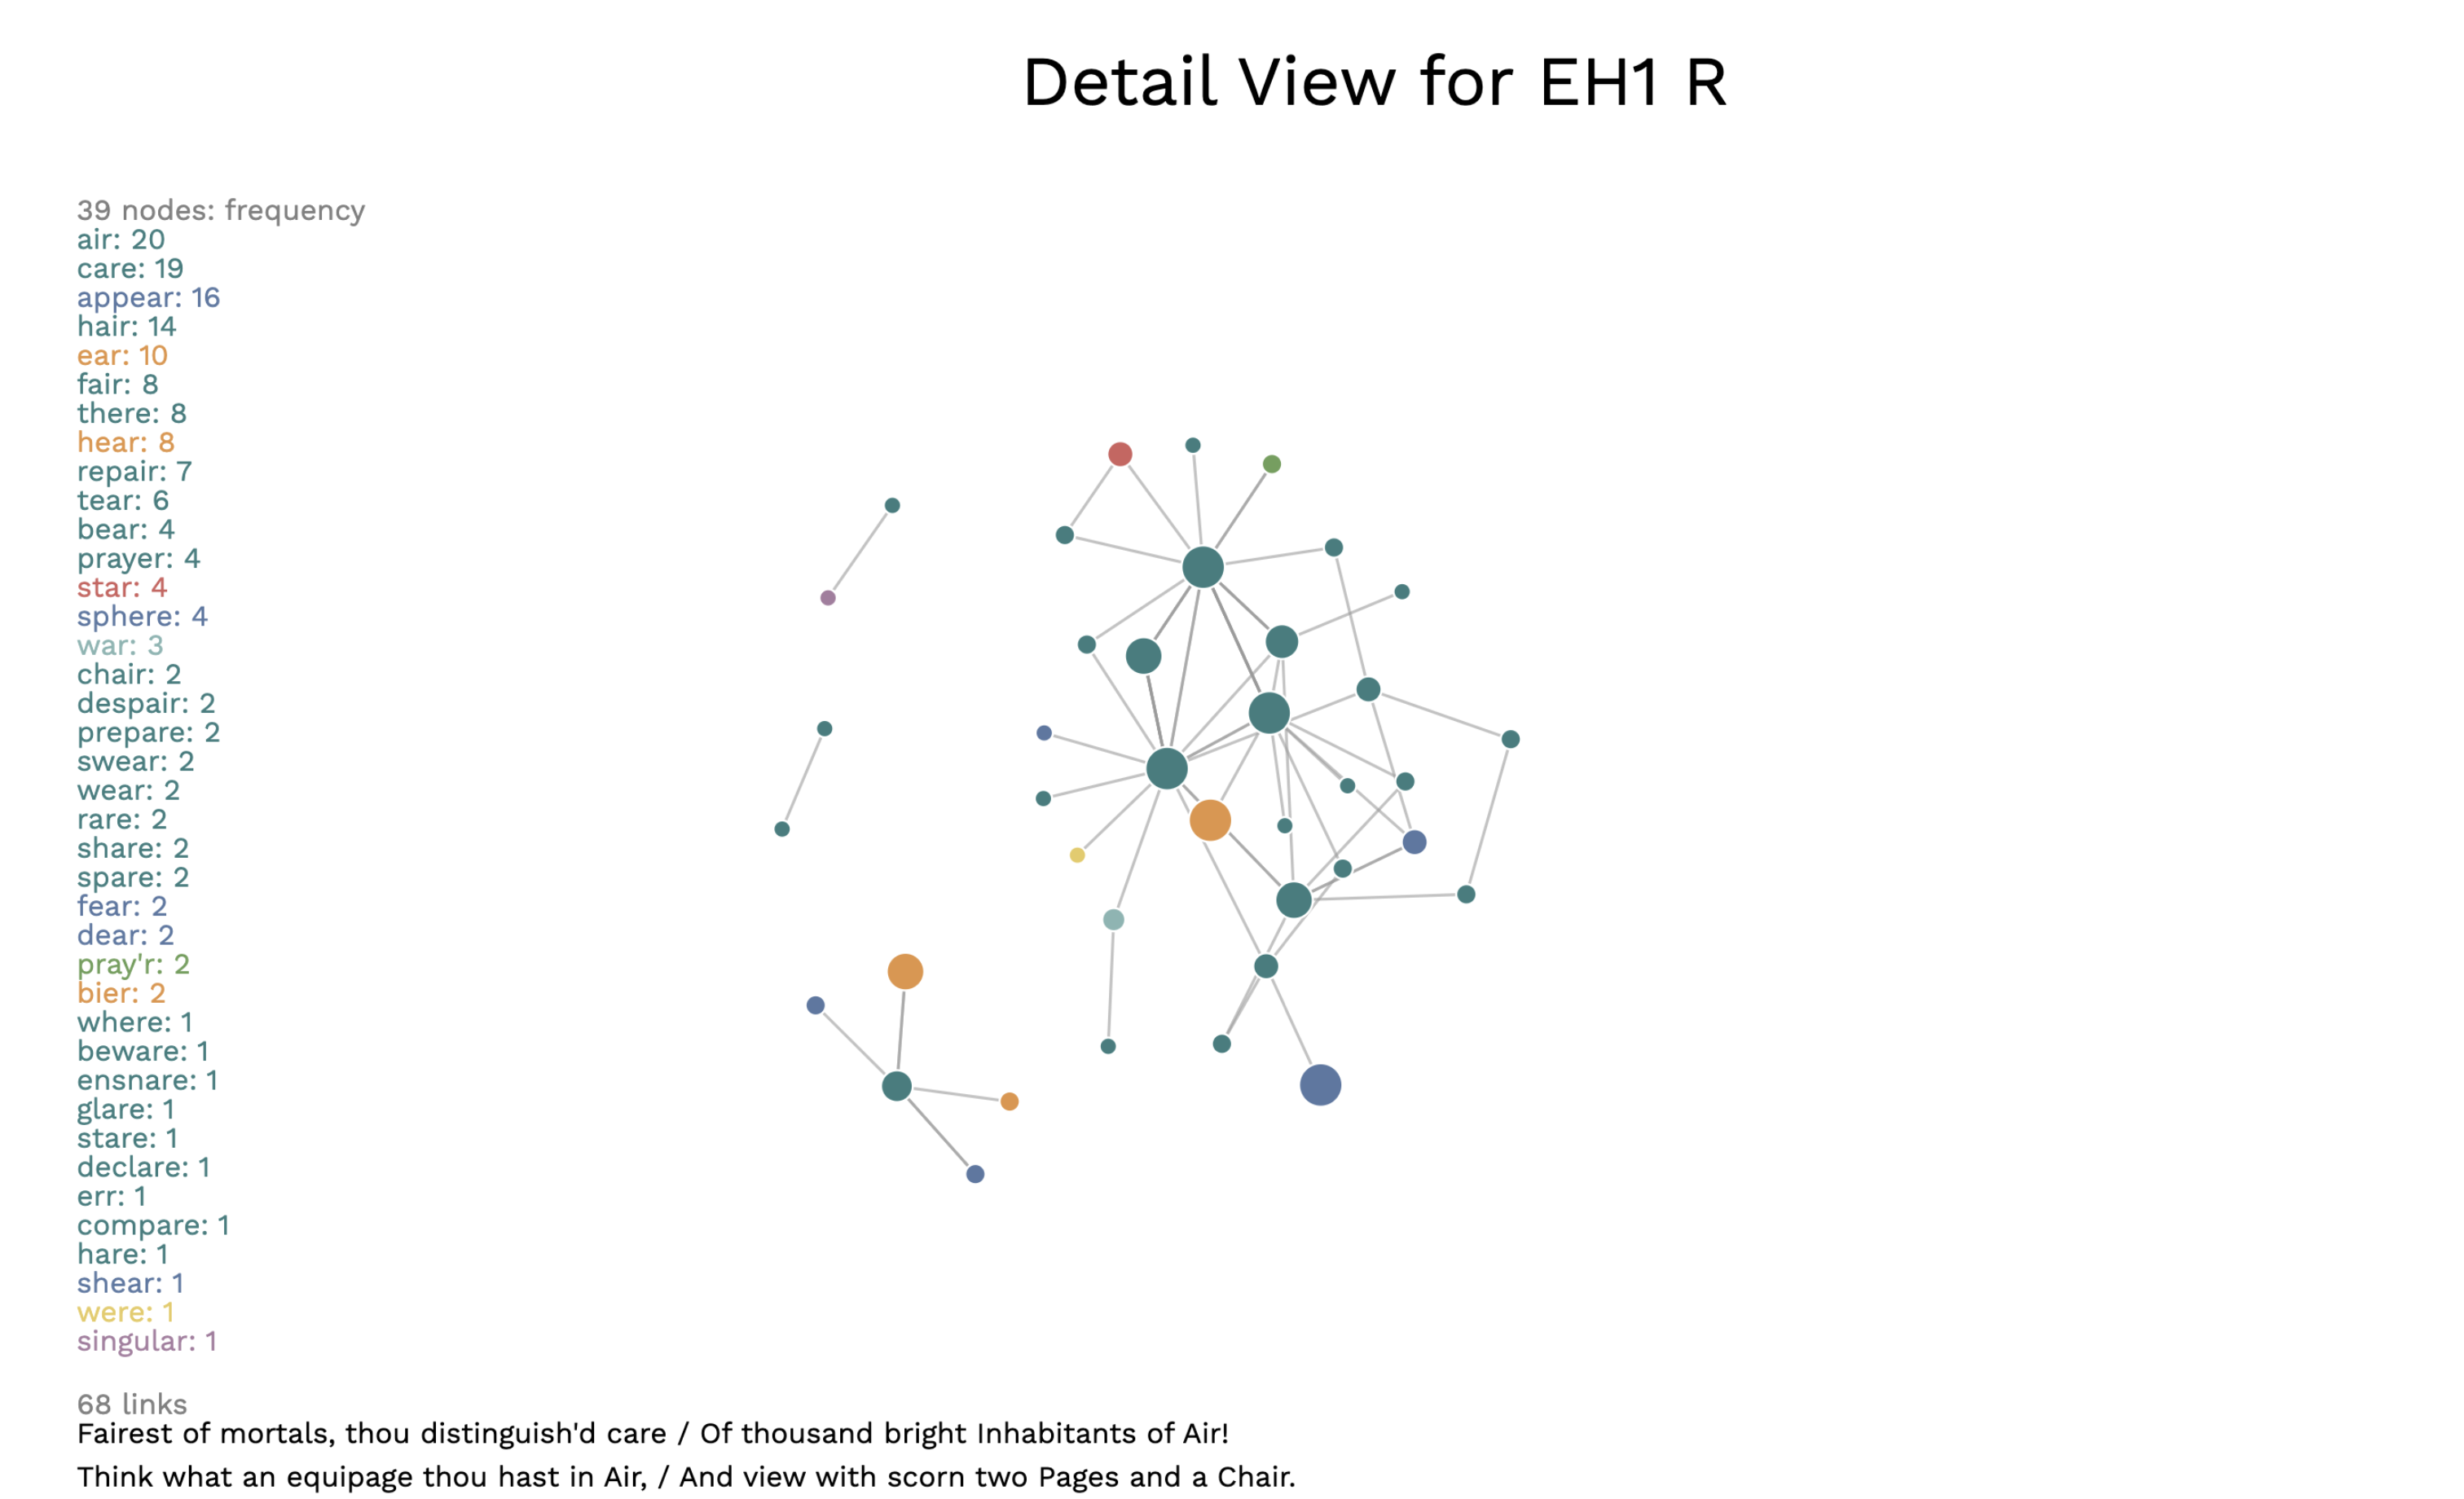
Every phoneme group, when clicked, has an associated detailed, quantitative view for each phoneme group, expanding its node size and displaying all nodes, their frequencies, and every link. This addressed key limitations of the main visualization:
To keep diagrams readable, I capped node sizes at 10 on the main page, even for high-frequency words. The detailed view resolves this by explicitly listing all node frequencies. Some words rhymed frequently, creating multiple links that HTML tooltips couldn’t fully display. The detailed view solves this by listing all links within each phoneme group.


